

AI-Powered Observability for the Modern Enterprise
Cutting MTTR, Cost, and On-Call Burnout With Self-Hosted, eBPF-Native, AI-Driven Telemetry
A Wohlig Transformations Whitepaper
Executive Summary
Enterprise observability is structurally broken. Legacy APM platforms (Datadog, New Relic, AppDynamics, Dynatrace, Splunk APM) extract six-figure-per-year licensing fees while delivering symptoms rather than diagnoses. Engineers receive alert storms, not explanations. Data governance teams flag the export of telemetry to multi-tenant SaaS as a compliance risk.
A new generation of self-hosted, eBPF-native, AI-driven observability platforms changes the economics and the engineering reality. Wohlig builds and operates these platforms for customers across BFSI, healthcare, public sector, e-commerce, and SaaS — combining zero-instrumentation telemetry capture, SLO-driven alerting, and AI-powered Root Cause Analysis to cut MTTR by ~80%, observability TCO by 60–80%, and cloud waste by 15–30%, all while keeping telemetry inside the customer’s own perimeter.
This paper outlines the technical architecture, operating model, and business outcomes.
1. The Problem with Legacy APM
1.1 Cost
Per-host and per-GB pricing scales linearly with infrastructure. Most mid-to-large enterprises now report observability as one of their top three cloud-adjacent line items, often exceeding ₹5–25 crore per year.
1.2 Insight
Dashboards display what is wrong but rarely why. Engineers must correlate metrics, logs, and traces by hand under incident pressure. Senior SREs become single points of failure.
1.3 Coverage
SDK-based instrumentation is partial, drifts over time, and is inconsistently maintained across teams. New services launch with minimal telemetry.
1.4 Alerting
Threshold-based alerting produces storms during real incidents. On-call engineers learn to triage by “which service is hardest to silence” — the opposite of what you want.
1.5 Sovereignty
Sending production telemetry — which contains customer identifiers, transaction patterns, internal infrastructure layout, and security signals — to a third-party multi-tenant SaaS is increasingly unacceptable to legal, compliance, and CISO teams.
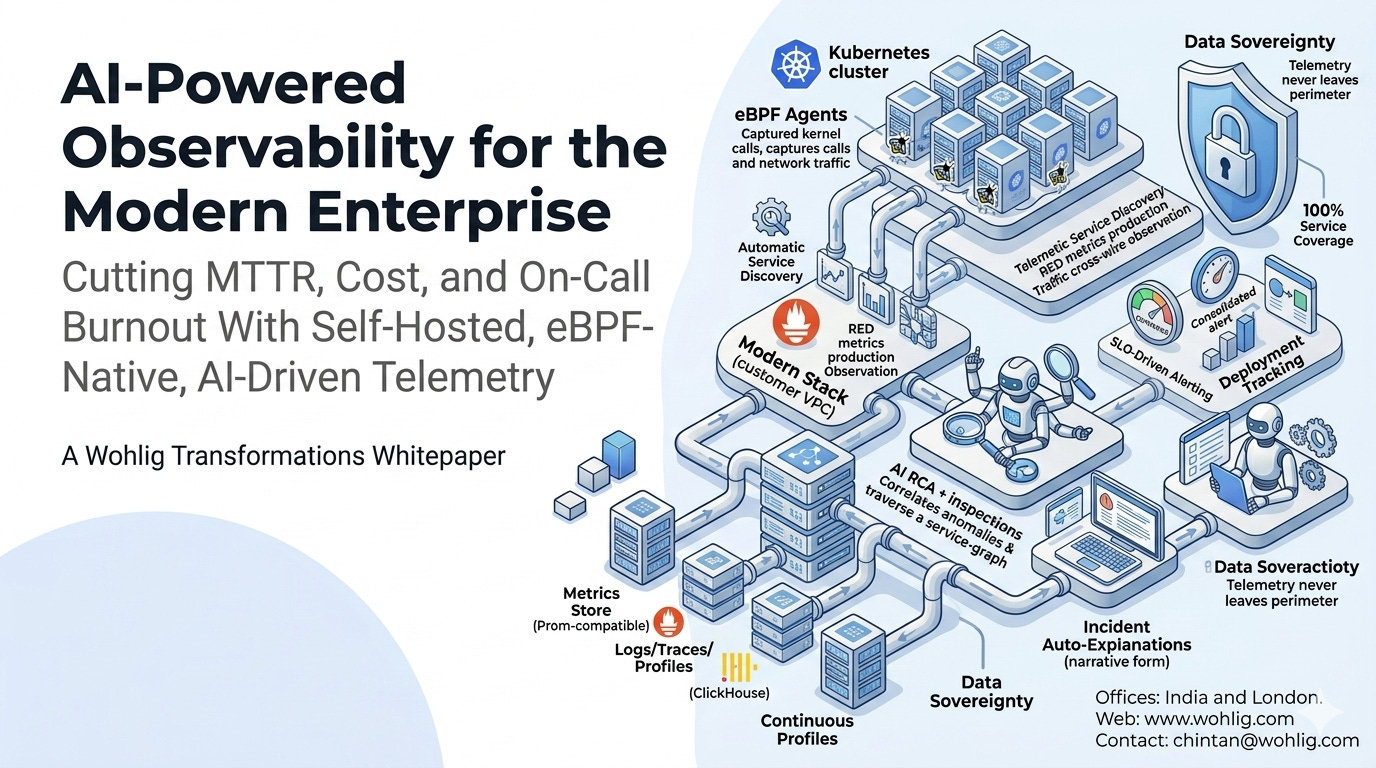
2. The Modern Pattern: AI-Powered, Self-Hosted Observability
2.1 Zero-instrumentation telemetry via eBPF
Rather than asking developers to instrument every line of code, eBPF agents capture network and system calls at the kernel level. They observe HTTP, gRPC, Postgres, MySQL, Redis, Kafka, and MongoDB traffic as it crosses the wire — automatically discovering services, mapping dependencies, and producing RED metrics (rate, errors, duration) on every edge from the moment they are deployed.
2.2 SLO-driven alerting
Alerts are bound to user-visible Service Level Objectives, not to raw threshold tripwires. The system emits one consolidated alert per service when an SLO is at risk — eliminating the alert storm pattern.
2.3 AI Root Cause Analysis
When an alert fires, an AI engine walks the discovered service dependency graph, correlates anomalies across metrics, logs, traces, and continuous profiles, and produces a narrative explanation identifying the failing pod, query, deploy, or upstream dependency. In Wohlig deployments, 80%+ of incidents are auto-explained at the moment of detection.
2.4 Continuous profiling
Code-level profiles run continuously and pinpoint the exact line burning CPU or RAM. Capacity and performance regressions are caught at commit-and-deploy time, not after a customer complains.
2.5 Deployment tracking
Every release is automatically compared against the previous baseline: latency, errors, and cost. Bad deploys are flagged within minutes, giving engineering an automatic rollback signal.
2.6 Data sovereignty
The entire stack — agents, storage, analysis, UI, AI engine — runs inside the customer’s own VPC or on-prem environment. Telemetry never leaves the perimeter. AI inference can be routed to a customer-controlled model endpoint for high-sensitivity environments.
3. Reference Architecture
┌───────────────────────────────────────────────────────────-┐
│                     Kubernetes Cluster(s)                  │
│                                                            │
│   [eBPF Agent]   [eBPF Agent]   [eBPF Agent]   ...         │
│        │              │              │                     │
└────────┼──────────────┼──────────────┼─────────────────────┘
         ▼              ▼              ▼
   ┌──────────────────────────────────────────────────-┐
   │   Observability Platform (customer VPC)           │
   │                                                   │
   │   ┌─────────┐  ┌────────────┐  ┌───────────────┐  │
   │   │Metrics  │  │ Logs/Traces│  │  Continuous   │  │
   │   │(Prom)   │  │ (ClickHouse)│ │  Profiles     │  │
   │   └────┬────┘  └─────┬──────┘  └───────┬────────┘ │
   │        │             │                 │          │
   │        └─────────────┼─────────────────┘          │
   │                      ▼                            │
   │           ┌──────────────────────┐                │
   │           │ AI RCA + Inspections │                │
   │           └──────────┬───────────┘                │
   │                      ▼                            │
   │           ┌──────────────────────┐                │
   │           │  SLO Alert Manager   │──▶ Pager/Chat  │
   │           └──────────────────────┘                │
   │                      ▼                            │
   │           ┌──────────────────────┐                │
   │           │  Single-Pane UI      │                │
   │           └──────────────────────┘                │
   └───────────────────────────────────────────────────┘
Stack: eBPF agent (DaemonSet), Prometheus-compatible metrics store, ClickHouse for logs/traces/profiles, OpenTelemetry-compatible ingest, Helm-based Kubernetes deployment, Apache 2.0 open-source core. Coexists with existing Prometheus / OTel collectors.
4. Business Outcomes
MTTR reduction — 60–85%
Observability TCO reduction — 60–80%
Cloud-cost reclaim from continuous profiling — 15–30%
Coverage of services with telemetry — from 40–60% (SDK-based) to ~100% (eBPF)
Alert volume reduction — 70–90%
Time-to-onboard a new service — from days/weeks to minutes
5. Where AI Specifically Earns Its Keep
The AI layer is not a marketing label. It is doing four concrete jobs:
Anomaly correlation across telemetry types — connecting a latency spike to a slow query to a CPU profile hotspot to a deploy event, in one pass.
Service-graph traversal — walking the dependency graph to find the originating failure rather than the loudest one.
Narrative generation — turning a multi-dimensional anomaly into a sentence a tired on-call engineer can read and act on.
Capacity and cost reasoning — proposing right-sizing actions from continuous profile and request data, with estimated savings.
Each is independently audited by Wohlig’s evaluation harness during deployment, with escalation paths back to human review for high-consequence decisions.
6. Engagement Model
Phase A — Foundation (3–4 weeks). Deploy the platform in a single non-production cluster. Validate eBPF compatibility, ingest, and AI RCA on a representative workload. Train the SRE team.
Phase B — Expansion (6–10 weeks). Roll into production clusters. Configure SLOs for top business services. Wire alert routing to PagerDuty / Opsgenie / Slack. Begin parallel-running with the legacy APM.
Phase C — Decommission and Operate (ongoing). Cut over from the legacy APM on a schedule. Wohlig stays as managed service, hybrid, or advisor depending on customer preference.
7. About Wohlig
Wohlig Transformations is a digital transformation, cloud, and AI consulting firm founded in 2016. We have completed 20+ cloud migrations, shipped 10+ generative-AI solutions in production, and hold 40+ Google Cloud certifications. We serve governments (Maharashtra, Gujarat, ONDC), enterprises (Lodha, Eros Now, Hungama), and high-growth consumer companies (Swiggy, Ninjacart, PW Live).
Offices: India and London. Web: www.wohlig.com.
To discuss your observability transformation, reach Wohlig at chintan@wohlig.com.