

You Don't Need Another Tableau License. You Need BI That Lives in Git.
Wohlig Transformations · Data Engineering
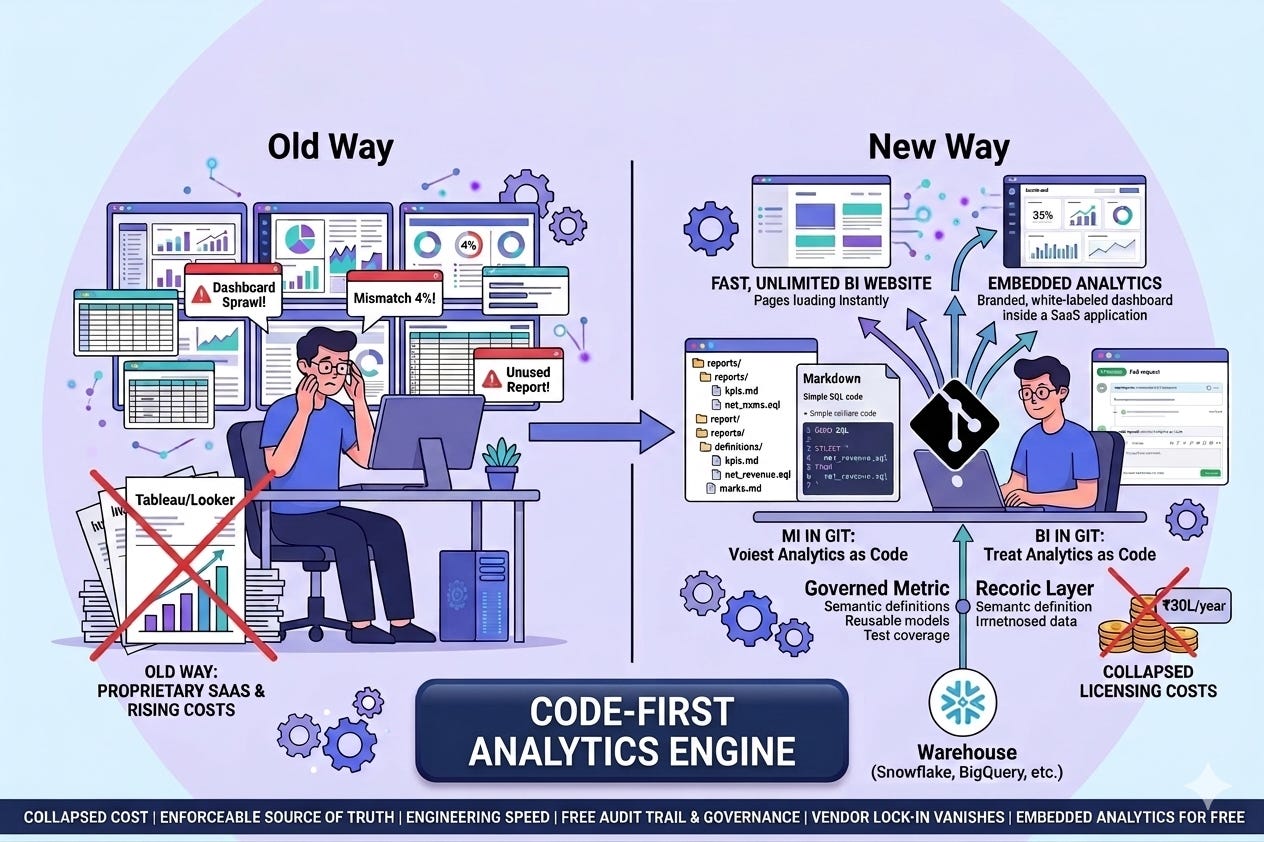
The dashboard sprawl in the average enterprise data team is, at this
point, a running joke. Eighty active dashboards, half of them
unused. Three different definitions of “active customer.” Two
parallel revenue numbers that disagree by 4%. A finance team that has
quietly given up and gone back to a spreadsheet. And a Tableau or
Looker bill that climbs every quarter as more “viewer seats” get
provisioned for people who only check one number once a week.
The core problem is not the tool. It is the model. Drag-and-drop BI
suites were built in the 2000s for a world where the analyst was the
bottleneck. In 2026, the bottleneck is governance — too many
definitions, too many dashboards, no single source of truth, and no
real audit trail when a number changes.
Wohlig’s recommendation for any company that has crossed this line:
stop buying BI seats and start treating analytics as code.
What “BI in Git” actually means
Imagine your KPIs not as drag-and-drop widgets in a vendor SaaS, but
as Markdown files in your own Git repository. Each file describes a
report — copy, charts, filters — using plain SQL queries against
your warehouse. To change a metric, you open a pull request. To roll
back a wrong definition, you git revert. To audit the history of
“net revenue”, you read the commit log.
When the file is built, it produces a fast static website that
business users open in a browser. Pages load in milliseconds because
the heavy lifting happened at build time. Read seats are unlimited
because there are no read seats — it is a website. The analytical
engine pushes down to your existing warehouse (Snowflake, BigQuery,
Redshift, Databricks, Postgres) and uses an embedded columnar query
layer for sub-second performance on the front-end.
Wohlig deploys this pattern inside the customer’s own cloud,
connected to the customer’s own warehouse, with the customer’s own
SSO and identity. Nothing leaves the perimeter.
What changes for the business
1. Licensing cost collapses. A mid-size enterprise running 200
Tableau viewer seats at ~$15/seat/month is paying ~₹30L per year for
people to look at numbers. The code-first pattern costs whatever
your warehouse and CDN cost — and adds zero per-seat licensing.
2. One source of truth, enforceable. Every metric is defined
once, in version-controlled SQL, reviewed via pull request. The
data team stops being the referee in revenue-definition arguments —
the answer is a permalink to the file.
3. Analytics ships at engineering speed. New reports in hours,
not weeks. No BI-admin ticket queue. Analysts who already write SQL
and use Git become productive on day one.
4. Audit and governance become free side effects. Git history is
the audit trail. Pull requests are the change-management workflow.
SOC 2, RBI, HIPAA, and DPDP teams stop asking “who approved this
change to the customer-acquisition-cost calculation” because the
answer is in the merge commit.
5. Embedded analytics for free. Want branded dashboards inside
your own SaaS product? It is a static-site embed. No second BI tool,
no second contract, no separate access model.
6. Vendor lock-in vanishes. Your reports are markdown and SQL.
They are portable, diffable, copyable. Your data stays in your
warehouse. There is no proprietary file format to escape.
Where this works
Mid-market and enterprise data teams already on a modern
cloud warehouse (Snowflake, BigQuery, Redshift, Databricks) and
comfortable with SQL and Git.Engineering-led organizations — fintech, SaaS, e-commerce,
logistics — where the analytics function reports into engineering.Companies actively trying to consolidate or replace Tableau,
Looker, or Power BI on cost grounds.Product teams wanting embedded white-labelled dashboards
inside their own SaaS — without spinning up a separate BI vendor.Regulated industries (BFSI, healthcare) needing on-prem or
VPC-hosted BI with full audit trail and no per-seat licensing.
What Wohlig adds
The code-first pattern is genuine open-source — Wohlig does not
charge license fees for it, and we say that openly. What Wohlig
charges for is the engineering that turns it into an enterprise-
grade analytics platform:
Warehouse architecture, source connectors, and query optimization.
A governed metric layer — semantic definitions, reusable models,
test coverage on critical KPIs.CI/CD for analytics: lint, dry-run, peer review, deploy on merge.
SSO, role-based access, row-level security where required.
Embedded analytics inside your product — branded, themed,
per-tenant.Migration from your existing Tableau / Looker / Power BI estate —
including consolidating duplicate definitions on the way over.An AI-chat-over-data layer for non-technical executives sitting on
top of the same governed SQL models.
We have been delivering this stack for customers across e-commerce,
ed-tech, BFSI, and government. We will deliver it for you in your
cloud, with your team, on your warehouse — and leave you fully
self-sufficient.
The honest summary
Drag-and-drop BI was the right answer in 2010. In 2026, the same
companies that have moved their code, their infrastructure, and
their security posture into Git are still letting their analytics
live in a vendor SaaS with no diff, no review, no rollback, and a
per-seat bill that goes up every year.
The fix is structural. Move BI into the same engineering workflow as
the rest of your business. Wohlig builds it.
Wohlig Transformations builds AI, cloud, and data platforms for
governments, enterprises, and high-growth startups. 40+ Google Cloud
certifications, including a Data Analytics specialization. 20+ cloud
migrations delivered. Founded 2016. Offices in India and London.